MtigOS – Plotting sensor data from ESP8266, where all of the work has been done for you March 2, 2020
Posted by GuySoft in Android, diy, Electronics, linux.Tags: esp8266, IOT, Raspberry Pi, release
trackback

Raspberry Pi and esp8266 to give fancy graphs
Hey all,
This project started from a hackathon, where the organiser dumps a pile of esp8266 chips and sensors on a table that were up for grabs. I wanted build something that would take about 10 seconds to assemble and flash, and would be functional anywhere, no hardcoding of wifi settings and servers. Since I am the developer of CustomPiOS I also made a Raspberry Pi distro that has all the fancy dashboards pre-installed.
This work is also modular and written in a way you could build long lasting solutions, the code is all arranged so it’s easy to contribute and have a monitoring solution which is easy to customize.
What I am going to provide here is a set of tools, that would let you get pretty graphs from sensors with:
- NO coding required
- NO hardcoded wifi passwords or server settings
- NO soldering
- About 2-5 minutes assemble the hardware
- You get a standard which is supported in my dsitro and other devices. So you can use MQTT apps that are out there.
- Raspberry Pi image that sets up all the software that lets you see fancy graphs right away. Calling it MtigOS. It also automatically updates and is maintained.
- You are going to use Docker, without the need to know how to use Docker.
Cool tricks I am going to use:
- You press the reset button a couple of times to enter a web config interface available in an access point so you can set up your wifi and MQTT server
- I am saving you hosting this on a server and giving you the option to host this locally using a Raspberry Pi image.
- docker + docker-compose that sets up a database and graphing tool – everything is already all set up. So if you want a server instead of a Raspberry Pi you can use that too
no need to know docker.
It looks like this in the end:

Pre-shipped Grafana Dashboard

Temperature and PH sensor in an ice cream box, with a USB hub powering multiple sensors
I am using this solution for hydroponics system for PH and temperature, but can also use it to measure the temperature in my oven, soil moisture, basically anything you want. I would be happy to add additional sensors.
Hardware
All the firmware is available in this github repo
The hardware used is:
- ESP8266 – Any setup, I used both the WEMOS and NodeMCU 0.9/1.0 – Just make sure it has a reset button because some models don’t.
- Your local home network, basically you need to give the ESP8266 access to the Internet
- Sensors – Current sensors supported:
- Temperature sensor using DS18B20
- PH sensor – similar to this one
- Moisture sensor – get a capacitor sensor that looks like this, the cheap ones die after about 24 hours
Assembly
1. Temperature sensor
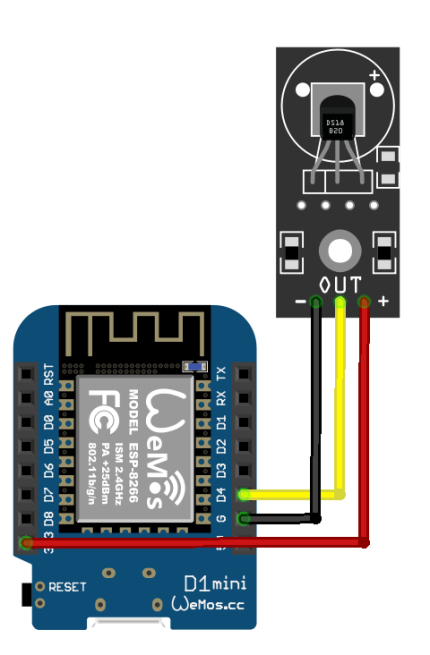
ESP and DS18B20 sensor
2. PH sensor
First, you need to calibrate the driver of the PH sensor as explained in the “PH probe module Offset and how to use it” section of this guide. You need to do it once.
Then assemble it as explained here:

ESP and PH sensor
3. Moisture sensor

Firmware
You need the following Arduino libraries installed, all can be installed from the LibraryManager:
- ArduinoJson 5, and LOWER
- DoubleResetDetect
- WifiManager
- Arduino plug and go library for the Maxim (previously Dallas) DS18B20 – For temp sensor
You also need the esp8266 boards from the Board manager as well.
Flash the firmware for the sensor you are using:
1. Temperature sensor ino – raw
2. PH sensor ino – raw
3. Moisture sensor ino – raw
Important: Make sure you set the Flash size to a number larger than 0.
You can set it by going in the Arduino IDE to Tools>Flash Size>4MB (FS:2MB).

How to set The ESP8266 to save the settings to its filesystem
That’s all the installation on the Arduino side of things. Lets move to the server side, we will return to what to do with your ESP8266 once we have a server set up.
Software
I am going to go a bit in to detail of what is going on below, you can ignore it. All you really need to know in this step is that if you flash the Raspberry Pi image, you will have all of this pre-installed and set up.
Raspberry Pi Method – Recommended
- Unzip the image and install it to an SD card like any other Raspberry Pi image
- Configure your WiFi by editing mtigos-wpa-supplicant.txt at the root of the flashed card when using it like a flash drive
- Boot the Pi from the SD card
- Hostname is mtigos (not raspberrypi as usual), username: pi and initial password is: raspberry
- After a few minutes you should be able to access http://mtigos.local/
Now that you have a server you need to set up your ESP8266 to connect to it, you can skip to that section below.
MtigOS github page with instructions how to flash a Pi image and set up wifi
Rather use your own server or anything with Docker and docker-compose installed
Then you can just use the docker-compose from the repo. I am going to assume you already have docker and docker-compsose installed. If you don’t know how to use them – just use the Raspberry Pi MtigOS image.
Download this repo and you will have all the docker-compose.yaml and setting files. Note that unlike the Raspberry Pi the port is port 3000 and not port 80 for the web service.
Some detail about what is installed
To display nice graphs we are going to use Grafana. I am going to use a popular solution which is:
- Sensor pushes data to MQTT
- Telegraf pushes data from MQTT to InfluxDB
- Grafana displays the data from InfluxDB
Installing and setting all this up is something I am going to save all the work for you. Just flash a RasperryPi with a distro with everything pre-installed.
I am calling it MtigOS ( Mosquitto, Telegraf, InfluxDB and Grafana ) OS.
Set Up the ESP8266 to Connect to your Network and MQTT server
Note that this step can be done by someone without any code of technical understanding this point. So you can give it to your friend, student etc.
Here is a video how to set up this phase (guide has an upgraded moisture sensor):
Text instructions:
- Press the ESP8266 button several times
- Search on your smartphone or phone for a wifi access point starting with ESP…
- Connect to it and then find the IP that you have. On android device you can do this by looking in the about section for the IP.
- Use the IP you found, for example 192.168.4.2 and replace the last digit with 1. So in that example it would be 192.168.4.1. Put that IP in your browser, you should get this page:
- Click on the button “configure wifi”
- Select you wifi SSID, insert your password
- In the same page fill in also your MQTT server address and the topic you want to publish to if you are using the Raspberry Pi image the server should be should be mtigos.local. and the topic should be to esp/moisture, esp/temp or esp/ph
- If you are using the PH sensor, here you will have an extra field that lets you set the calibration value of it. That is as explained in the calibration instruction I linked to above.
- This is important. Mtig/MtigOS has the default channels it listens to set as esp/moisture, esp/temp and esp/ph. So you must use these in the topic field. I put it as a setting because you can change this in grafana, or add multiple sensors this way. And because I am trying to avoid hardcoding. You can change which topics are saved to the database in telegraf.conf. And you will need to update your dashboards.
That’s it, you should have the Arduino publishing to MQTT, and Telegraf saving the data to InfluxDB.
Testing Tour Sensor is Reporting to the MQTT Server
This is a helpful step to make sure your sensor is indeed reporting to the server. You can look at it directly without looking at the graph, and it will confirm you got the previous steps right.
Its also convenient because it means you can check your smartphone for live status of the sensor readouts.
You can use a desktop tool such as MQTT.fx or an Android app such as IoT MQTT Panel. Anything you can put the Raspberry Pi/server IP address and then subscribe to the topic your ESP is publishing to (the topic you set it step 6.2 in the previous section.

IoT MQTT Panel from an android phone

MQTT.fx settings dialog

MQTT.fx receiving moisture information
Accessing the Grafana Dashboard
If you are using the MtigOS Raspberry Pi image, you need to set to open in a browser (port 80) the Raspberry Pi IP address. Or hostname http://mtigos.local/ . It might take a few minutes to start because the Raspberry Pi needs to connect to the internet and download the latest software. It does that automatically, and you must have internet available for the Pi for it to install the software.
The default user is “admin”. And the default password is also “admin”. After first login you will be asked to set a new password.
To reach the dashboard, click on “Home”, you should see under “general” a dashboard named “sensors”. The dashboard and telegraf are listening to the topics esp/moisture, esp/temp and esp/ph. You can edit and save anything you want in the dashboard.
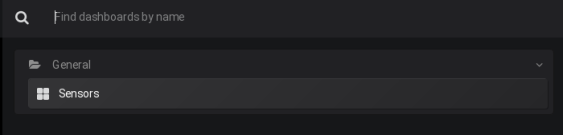
Sensors dashboard once you click on “Home”
You should see a dashboard like this:

Sensors Dashboard
Note you can edit and save any changes in the dashboard and create new ones. If you made useful ones you can export them and contribute to the default ones.
That’s it! You have a modern customizable IOT monitoring service, that is storing your esp data in to a database, which you can build a set up anywhere you like, and let other people use. Its using open source components. If you have the coding ability it’s easy to add support for new sensors.
I am using a setup of this for my hydroponics. Here is a photo of it on my balcony:

My hydroponics system in the first month

My hydroponics system today, 5 months later
Update: Adding new graphs
I was asked by the author of whatimade.today to explain how to add new sensors Grafana.
Indeed you can add them!
There are 2 things you can use to extend new sensors.
1. Changing the graphs + Listening to different MQTT topics
If you want to add new graphs you need to do two things – listen to new topics on telegraf, and then change the query for them.
Editing the graphs to use a different topic is pretty easy, you can click on them and duplicate, or simply edit the existing:

Clicking on the top of the graph opens a menu to duplicate or edit it
Once you edit it you can change the query. Its an influxdb database, which uses InfluxQL language. If all you want is to change the topic, you can just change it in the existing query:

This is the edit dialog, you can change ‘topic = ‘esp/temp’ to any other topic
If you know how to edit these queries, you can also change the graph completely here and add new functionality. Grafana comes with many types of graphs.
If you made a cool graph, we can also add it back in to MtigOS so everyone can use it. Simply export it by going to settings > json model. There you will have the code used to make the graph.
MtigOS is open source, and the graphs shipped are available here.
Listening to different MQTT topics
Next – make Telegraf save the data in the the database. Information from MQTT is not saved, only published. Telegraph is the tool that passes stuff from MQTT to the database. Only the topics you tell it to log. That setting is on the RaspberryPi on /boot/docker-compose/mtig/telegraf.conf.
The file is placed on the boot partition because that means you can open it from windows.
Change this section to list any topics you want added (or removed).
  ## Topics to subscribe to
  topics = [
    "esp/moisture",
    "esp/temp",
    "esp/ph",
  ]
If you want, for example, a new sensor esp/light. You can just add it like this:
 ## Topics to subscribe to
topics = [
"esp/light",
"esp/moisture",
"esp/temp",
"esp/ph",
]
2. New ESP sketches that uses different libraries
If you have a new sensor, that you want to use with your ESP, with its own driver you will need to write code for it to work.
Note: if you want to read the analog sensor, you can just use the source from moisture sensor sketch, which just spits out the result from analog. However, if your sensor uses a library, or you want something more complicated, you can and will have to edit the ESP code. But you have a good template to base off in this repo. I will be happy to add new sensors to support, and as always –
Code contributions are welcome!

Looks like a nice project, Well detailed. I am certainly going to try it. Probably with docker since I don’ t have a PI yet (doing Arduino projects so far). Any recommended PI model?
All pi models should work. I’d say 3 and above will give you better results with lots of data and web responsiveness. But even a zero should be fine.
Would you please mind sharing how you built your hydroponics system ?
Hey, yes sure. I followed this guide, unfortunately its in Hebrew so I doubt most will know how to read it. But you are welcome to take a look here.
Thank you !
This worked great for me – thank you. Until I tried to add a new sensor. Any help on what I’m doing wrong would be appreciated.
I have an ESP8266 up and running with the temperature sensor; the data appears on the Grafana temperature dashboard fine.
I made a second ESP8266 and set it up as esp/temp2; I added esp/temp2 to the telegraf.conf file; I duplicated the temperature graph and edited it to select topic = ‘esp/temp2’ etc.Nothing appeared on the new graph; the first still worked fine.
When I re-setup the 2nd ESP8266 as esp/ph, and edited the duplicated temperature graph to select topic = ‘esp/ph’, it worked ok.
MQTT.fx saw all of esp/temp, esp/temp2 and esp/ph.
To make it work using temp2, I assume an additional reference to esp/temp2 needs to be added somewhere, but I can’t find it – please help!
Did you restart the pi or docker container? You need to do so for the telegraf settings to take effect.
I re-started the pi after editing (using Notepad++) the telegraf.conf file. Do I also need to do something to re-start the docker container?.
FYI, the telegraf.conf section now looks like this:
## Topics to subscribe to
topics = [
“esp/light”,
“esp/moisture”,
“esp/temp”,
“esp/temp2”,
“esp/ph”,
]
I’ve had 2x ESP8266s (both programmed for temperature) running as esp/temp and esp/ph for the last few hours showing 2 temperature graphs with no problem. I just re-configured esp/ph to esp/temp2, and while MQTT.fx sees the change, the data in grafana for ph has stopped (as expected) but there’s still nothing for temp2.
Thanks!
I have it working. 🙂
I reflashed the pi with a ‘virgin’ mtigos, then edited both the wifi details and telegraf.conf before booting this new image for the first time. It now works with both esp/temp and esp/temp2.
My conclusion is that telegraf.conf is read at first boot, but not on subsequent boots. If someone could advise how to get the pi to re-read telegraf.conf without a complete re-image, that would be great.
thanks in advance
Dave
Why don’t u mention the hardware setup with Raspberry pi.
You flash it with the image and plug it to a wifi network/Ethernet. That is all. The software section explains that. The pi has no hardware setup different than plugging your phone really.